Get in touch
Download Brochure
Download Guide
Get in touch
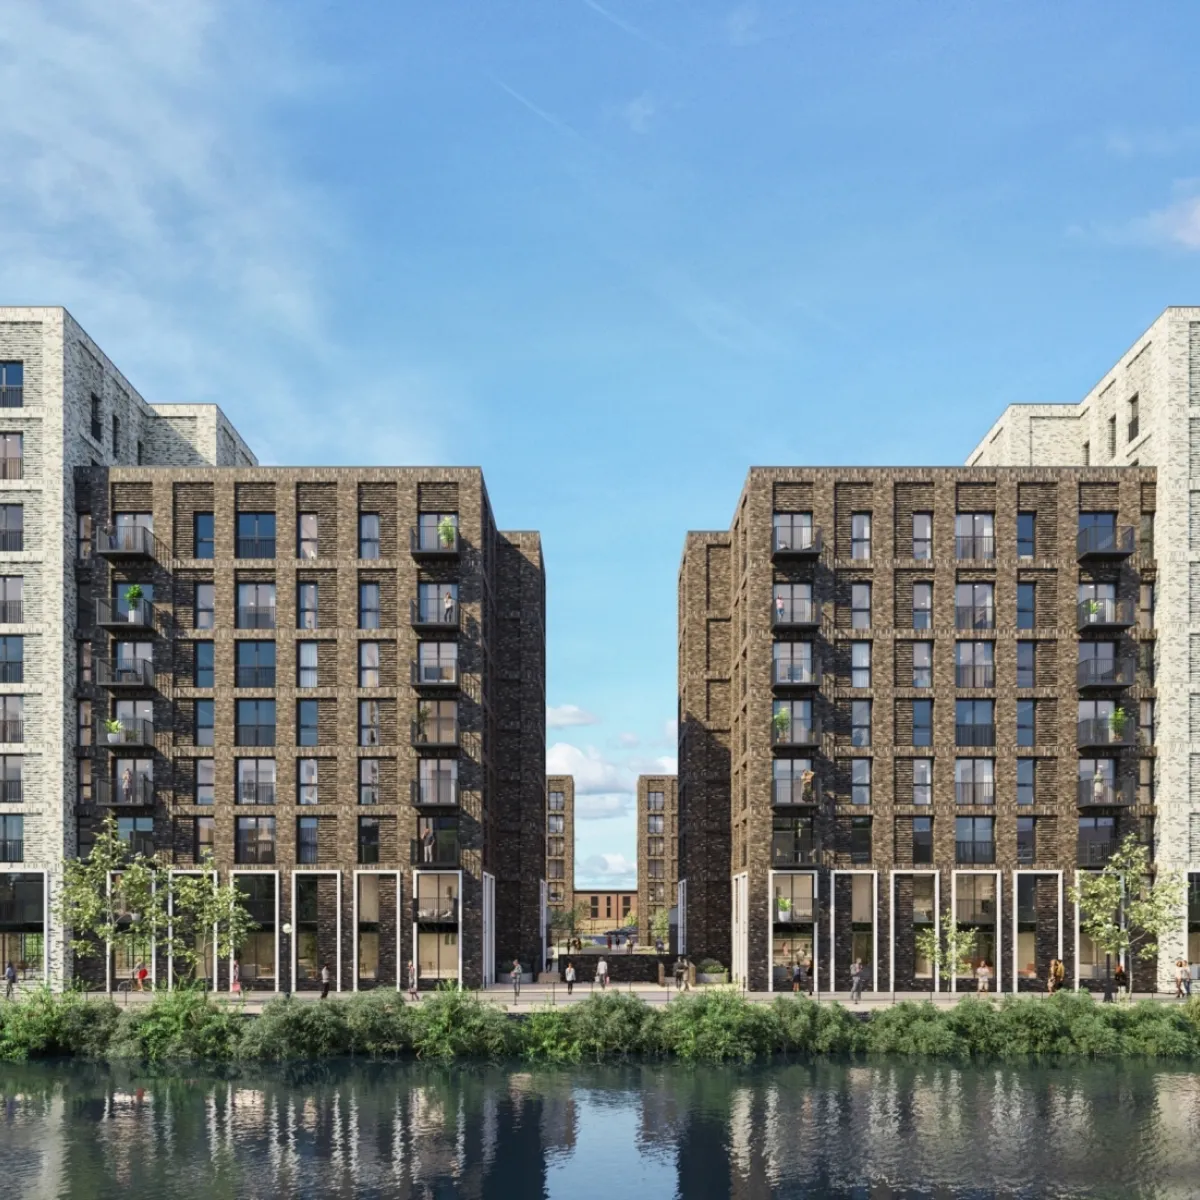
A range of UK property developments for all budgets & requirements.
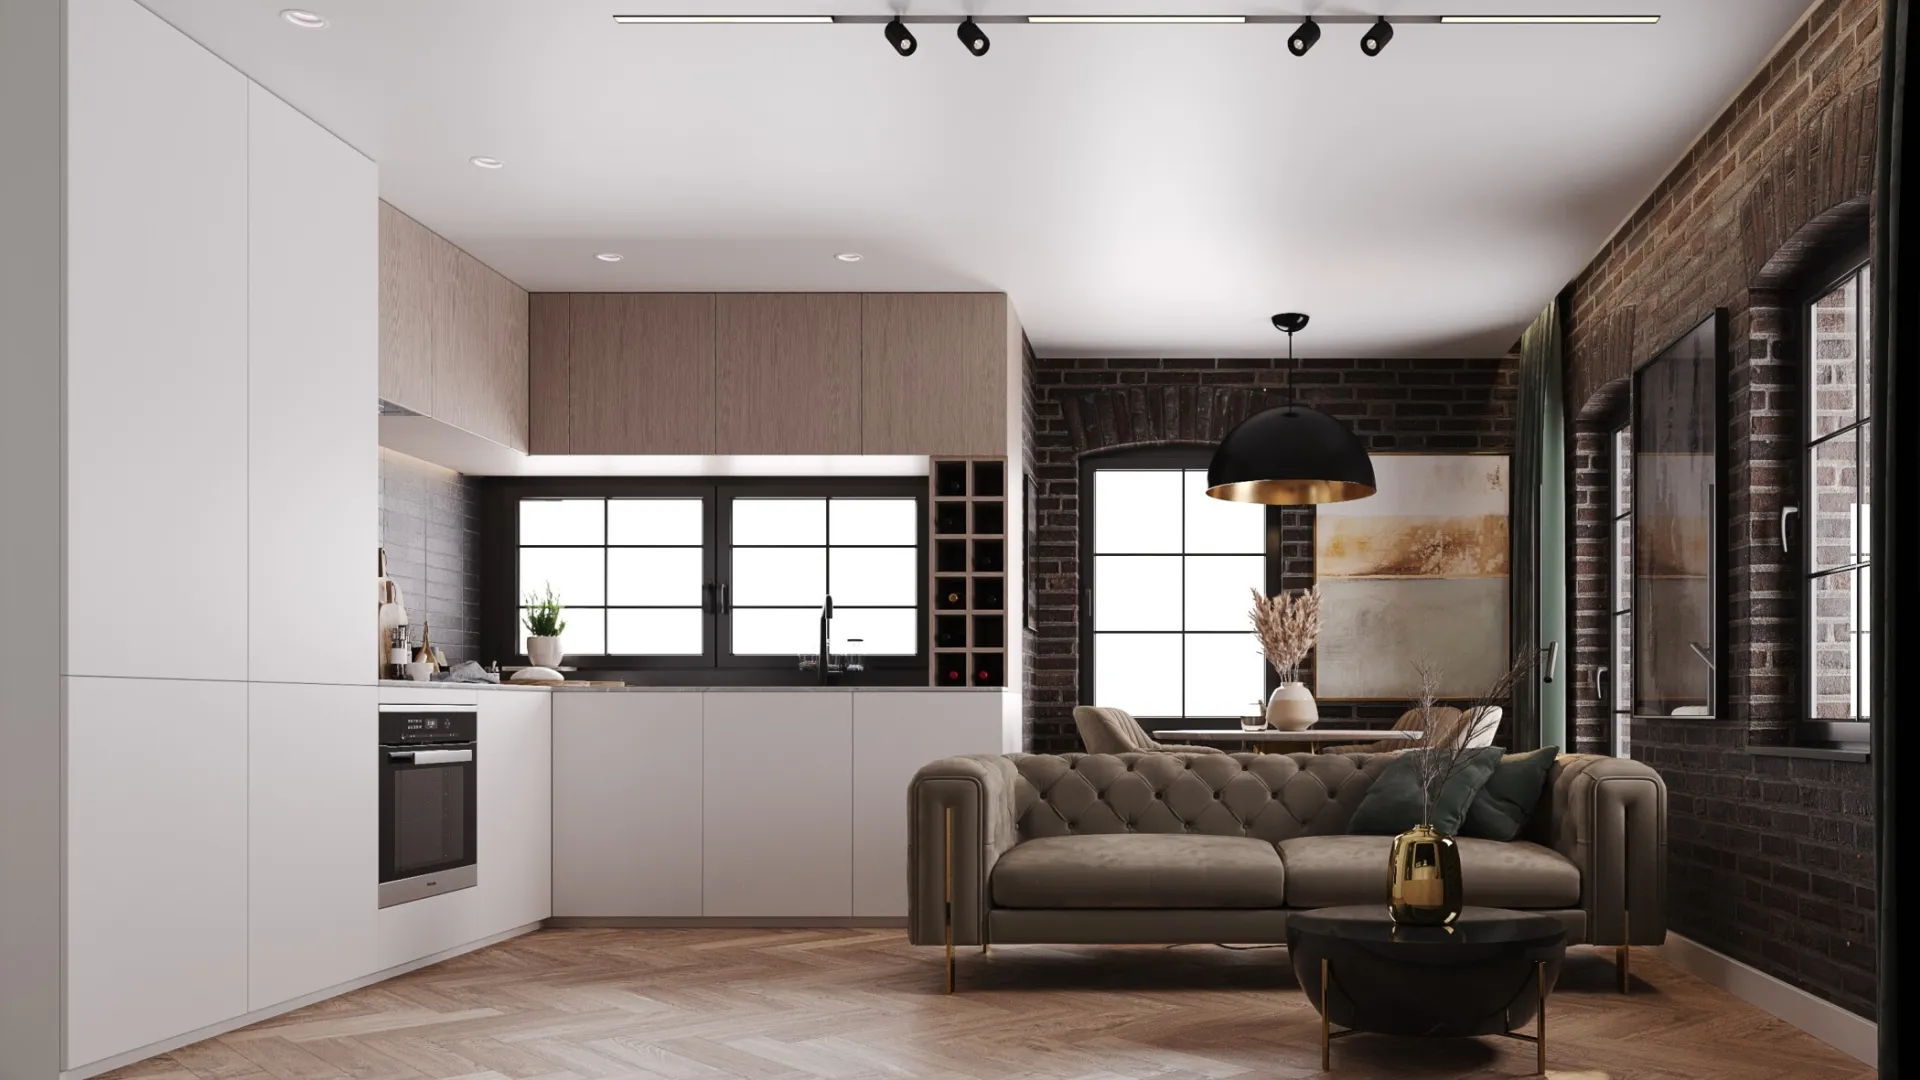
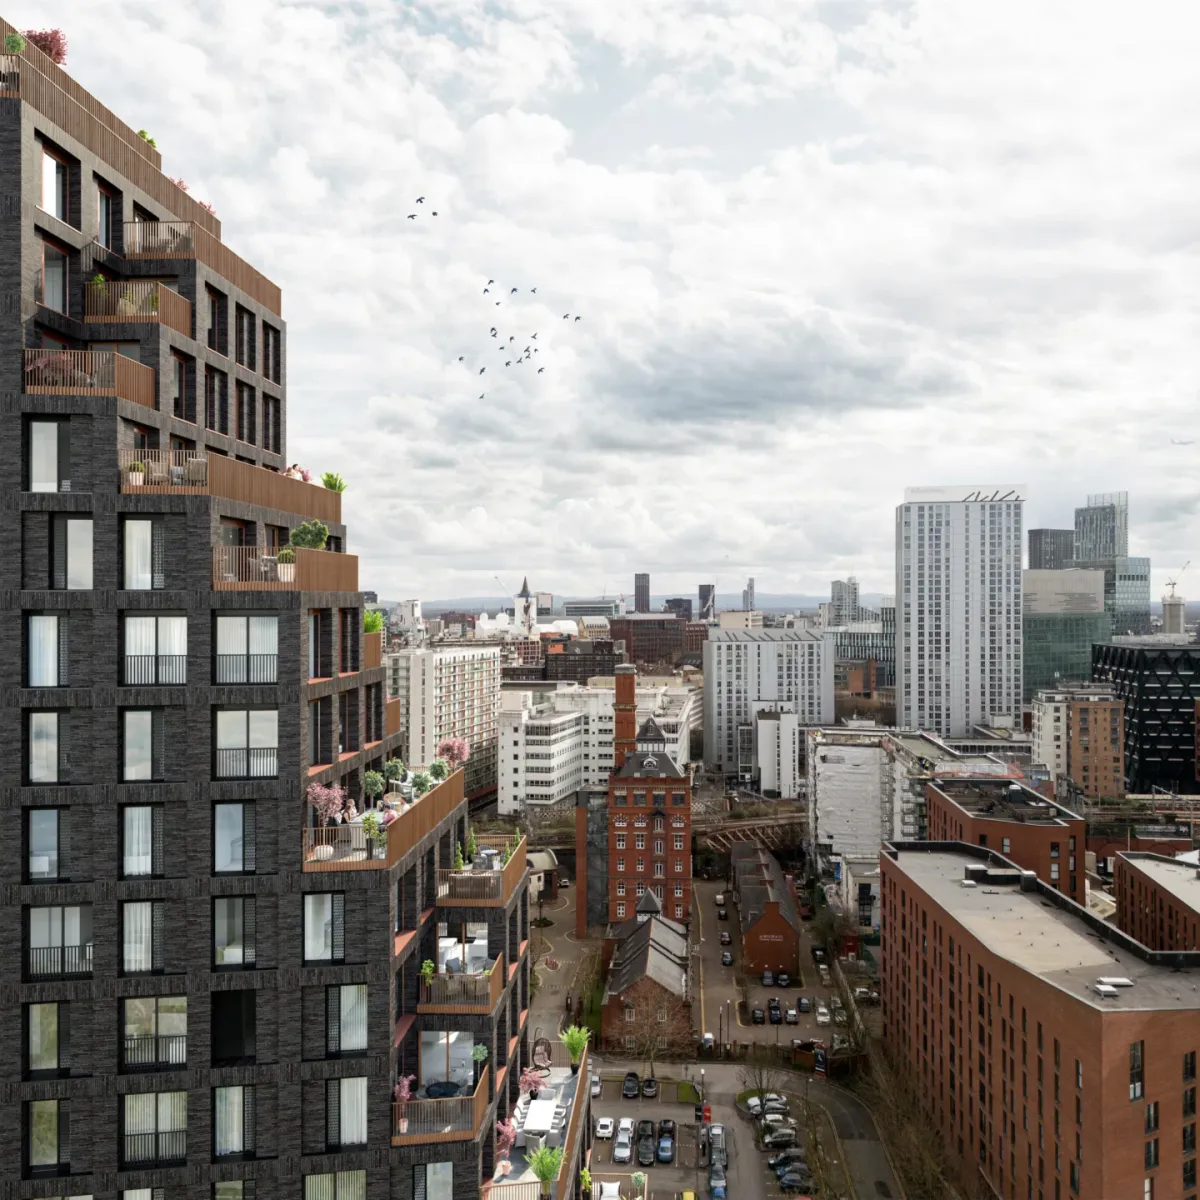
With over 25 years of experience, we are experts in sourcing a range of development types across UK hotspots such as Manchester and Leeds for our network of global investors.
From off-plan opportunities to completed properties, specialist supported housing investments and traditional investments that can be financed with a mortgage, we are committed to finding the right solution for you.
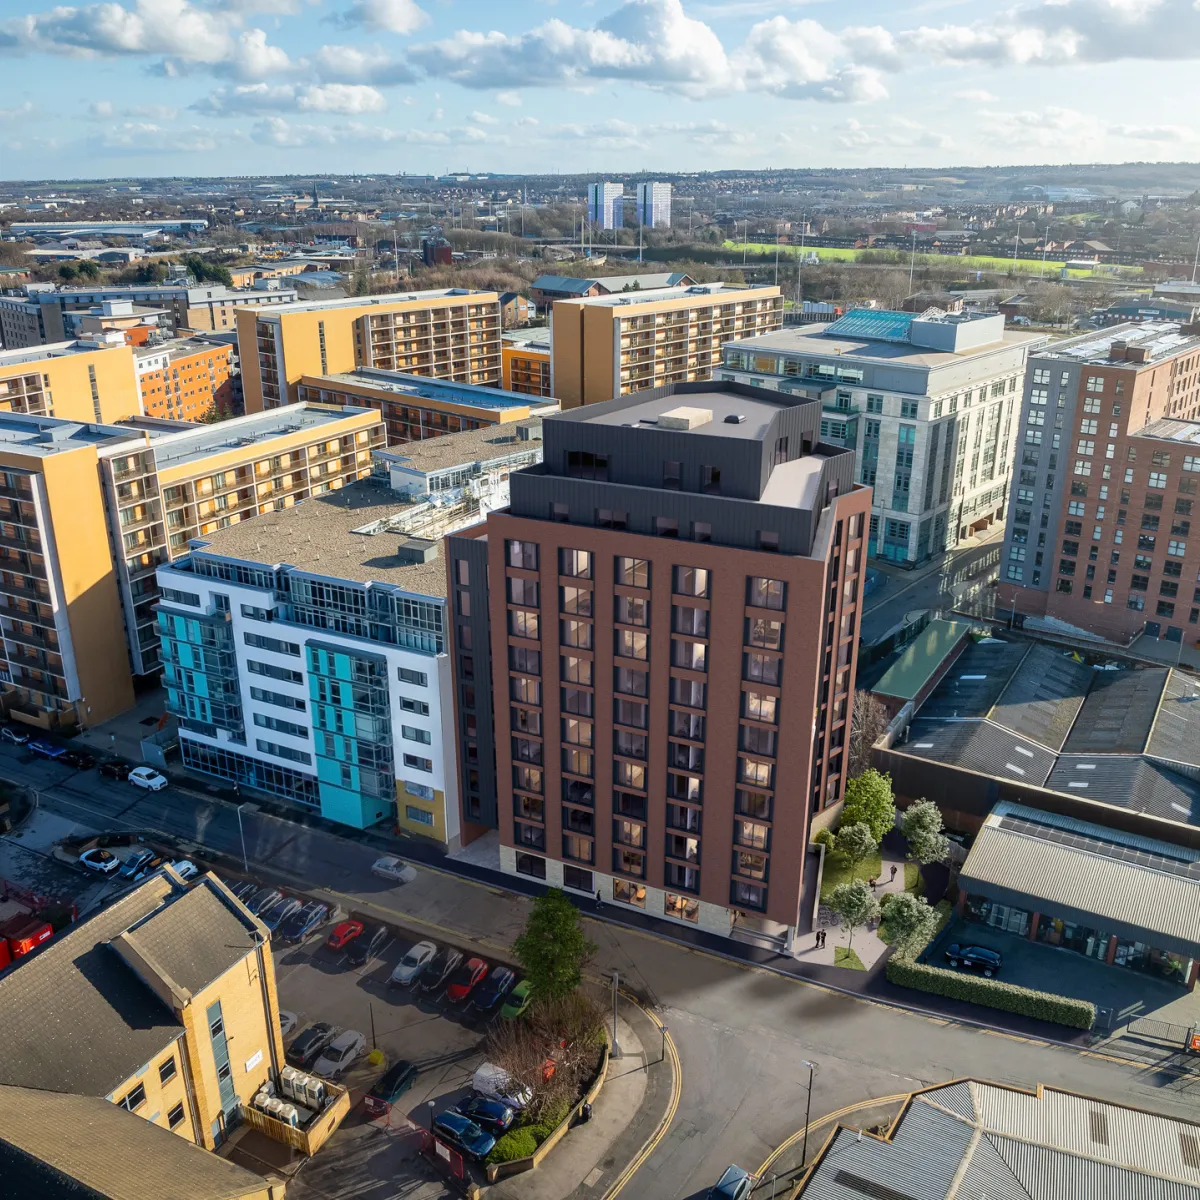
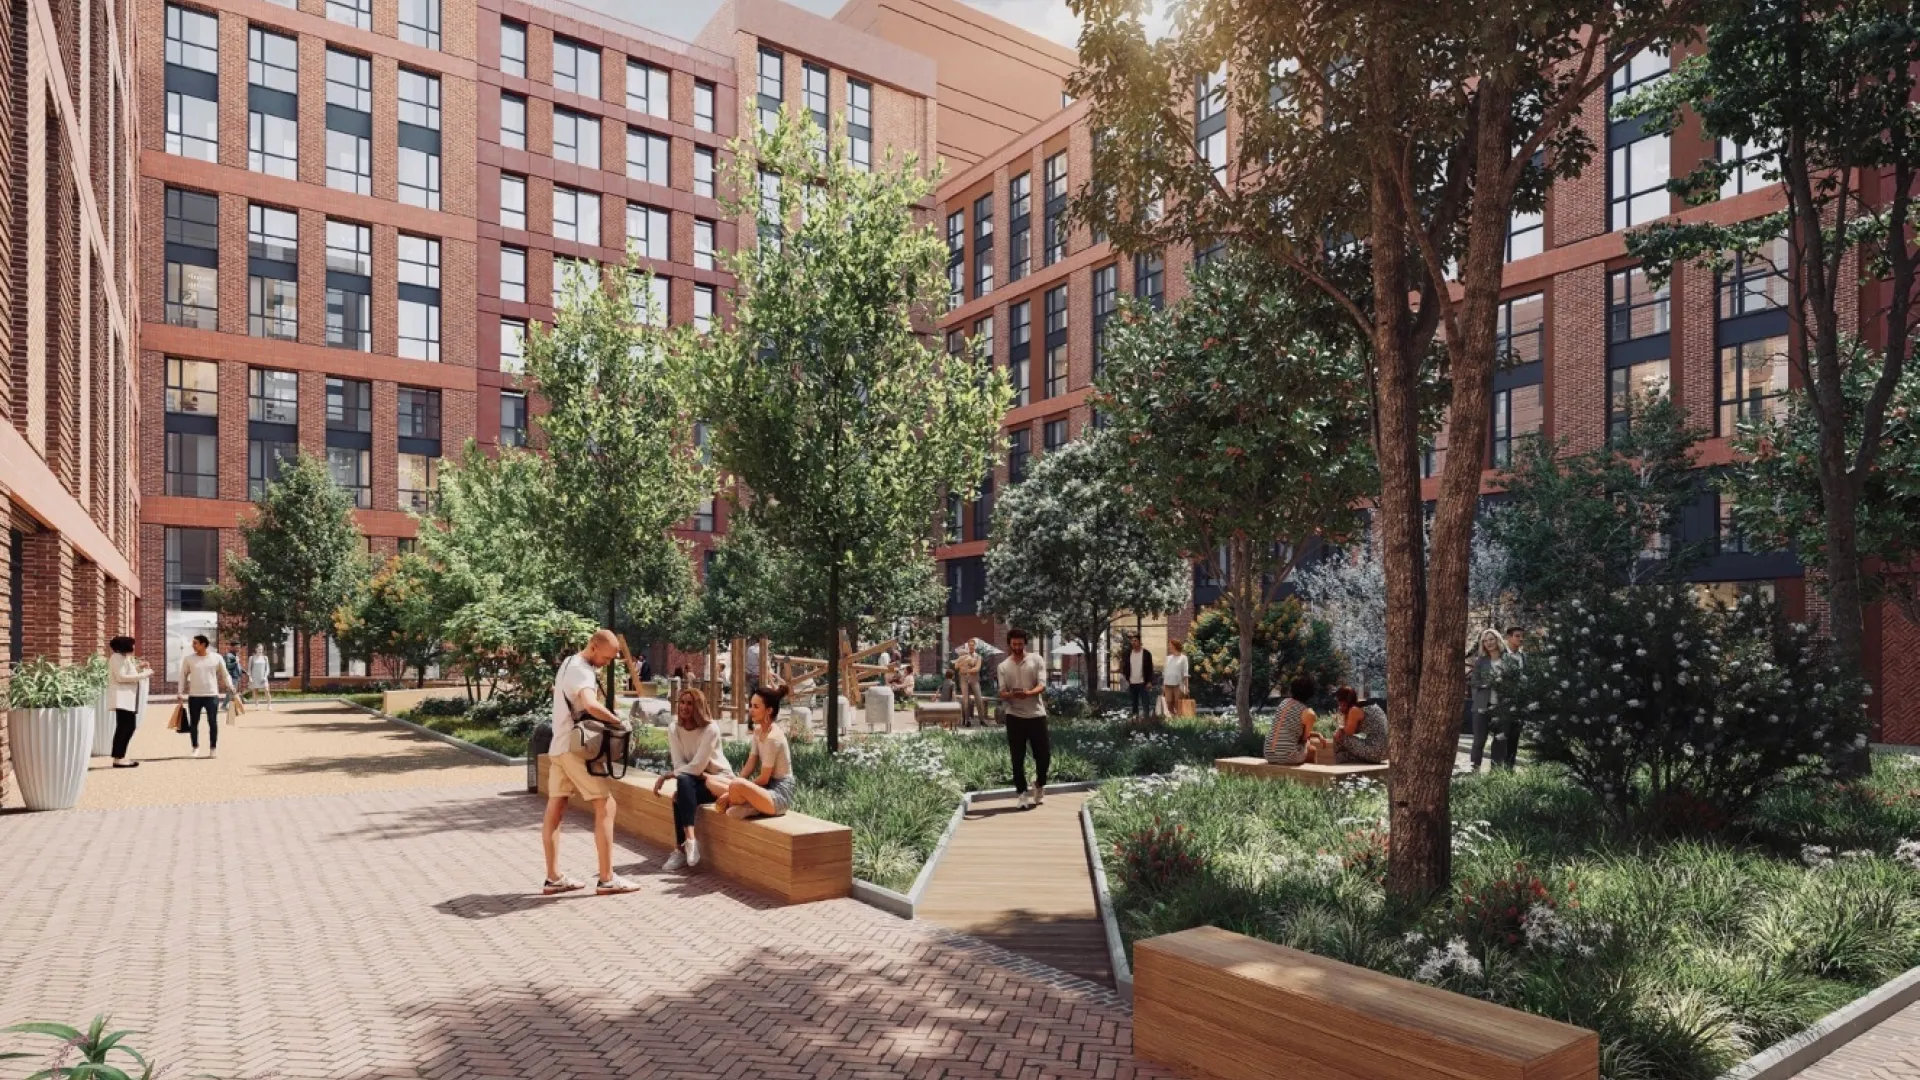
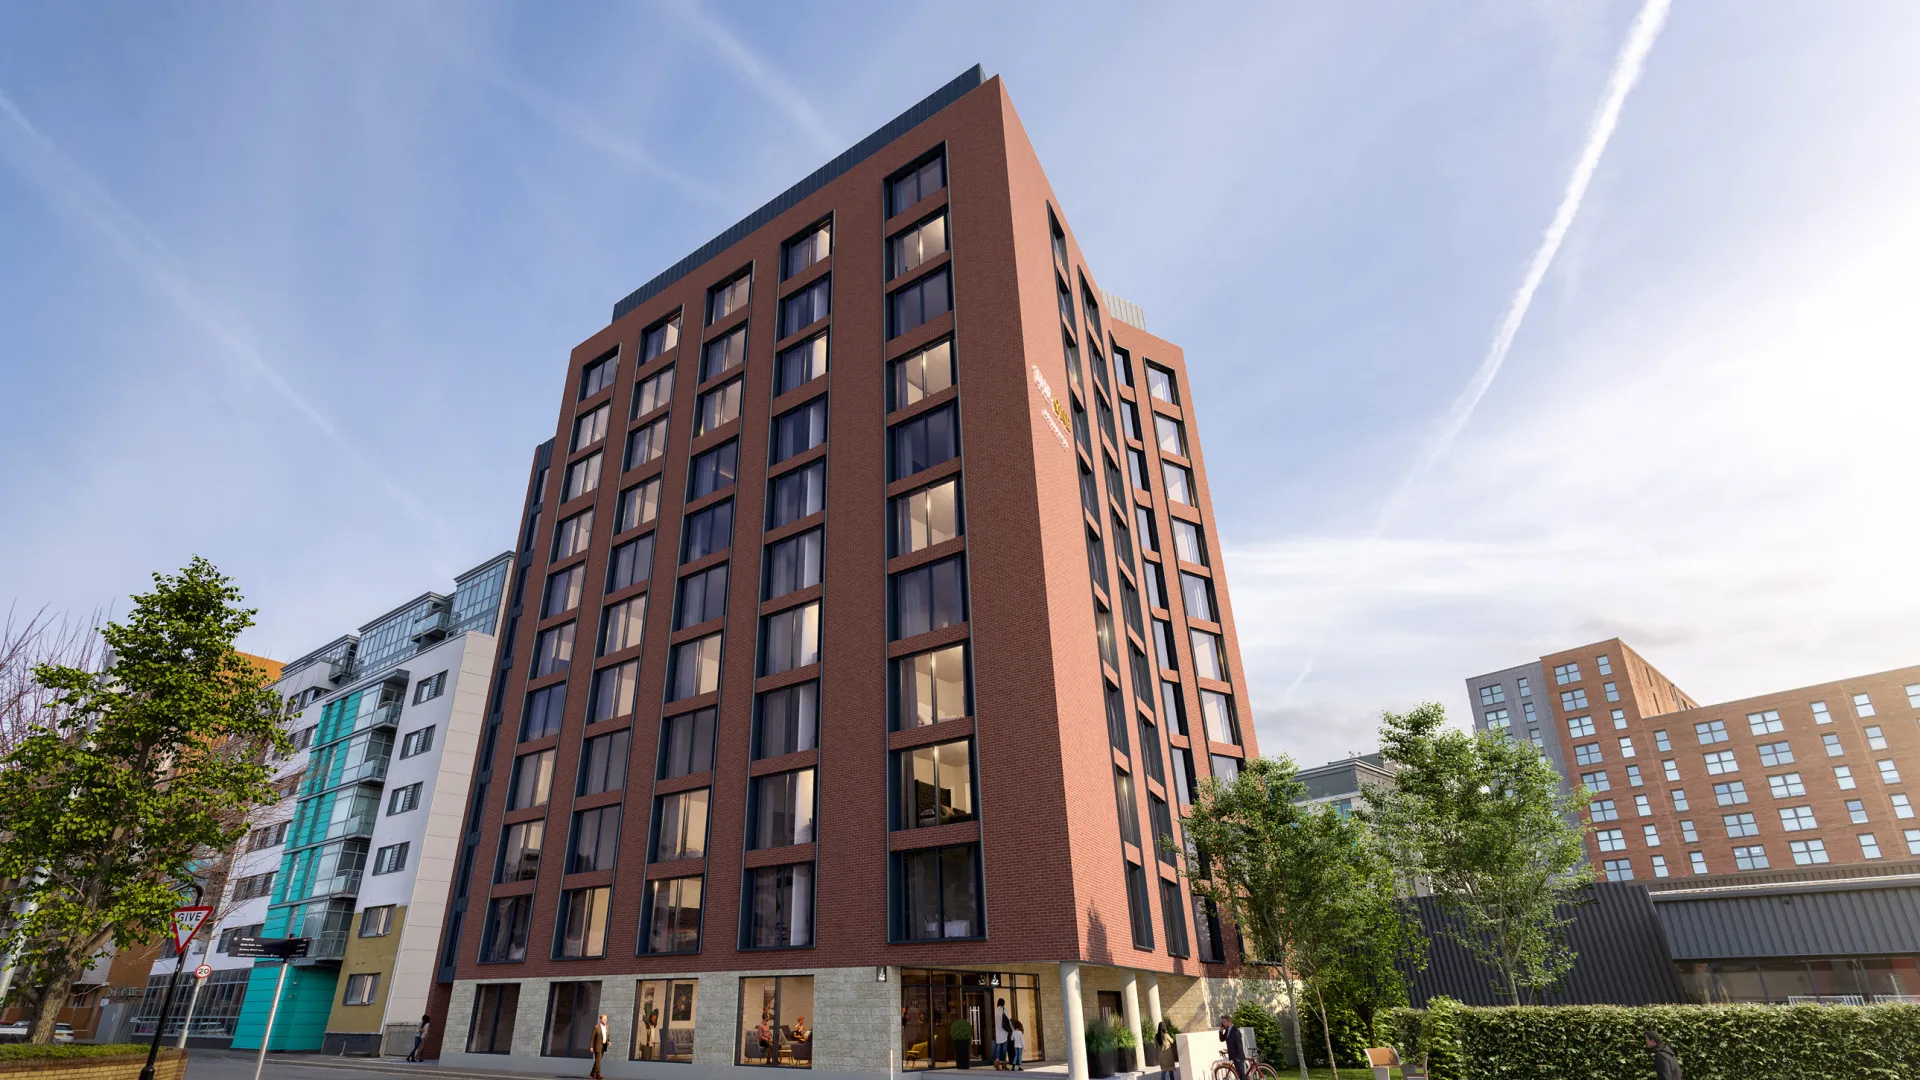
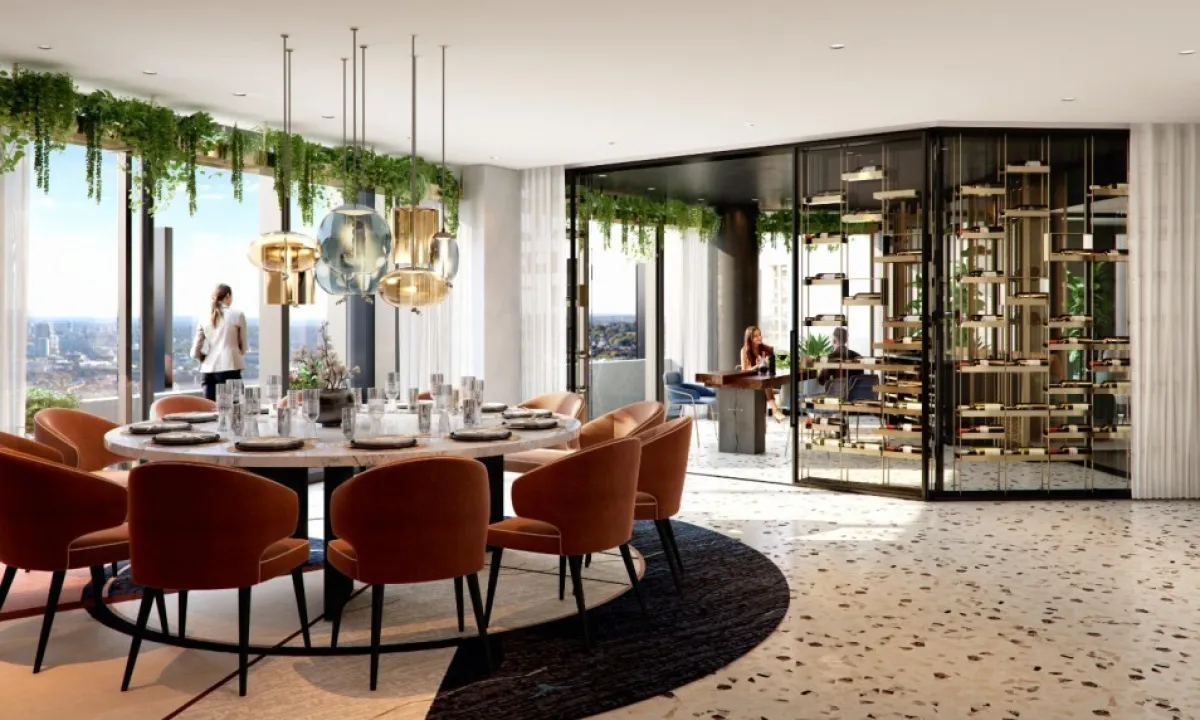
The One Residence | Leeds | From £190,000
- Brand new to market
- Approved for short term lets
- Returns up to 10%
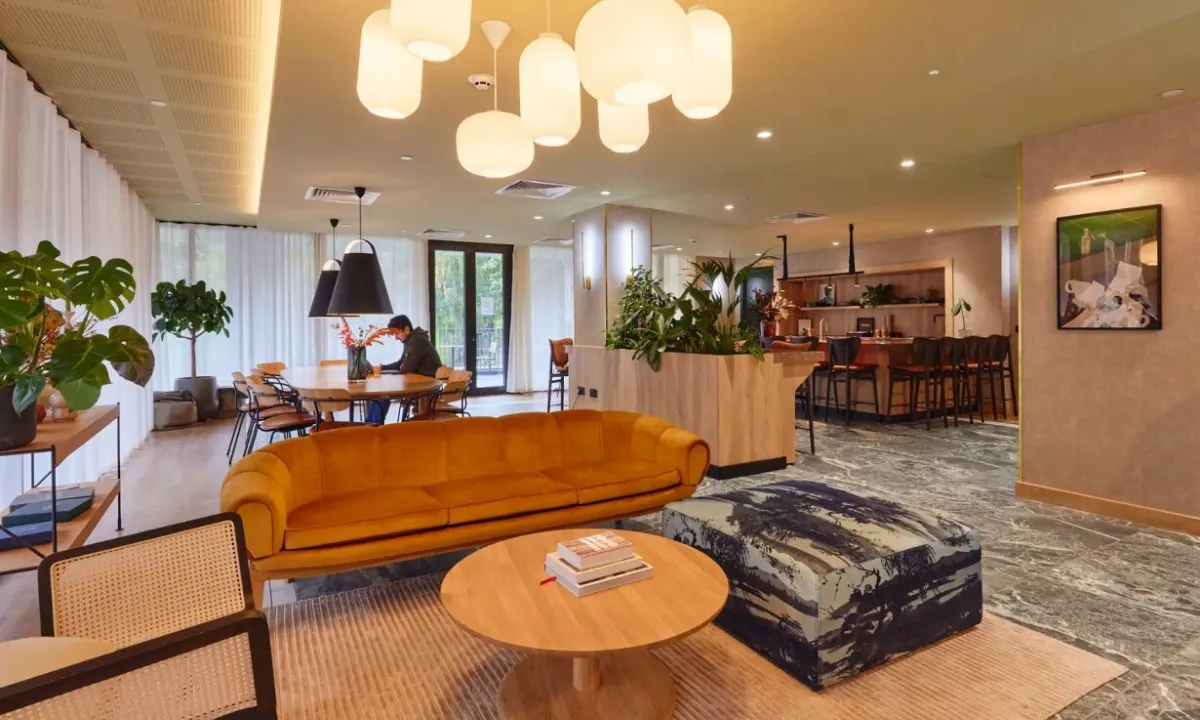
125 luxury apartments in Leeds city centre, combining chic design and modern comfort. Perfect for the traditional buy-to-let and the short-term let market.
Completed vs
Off-plan
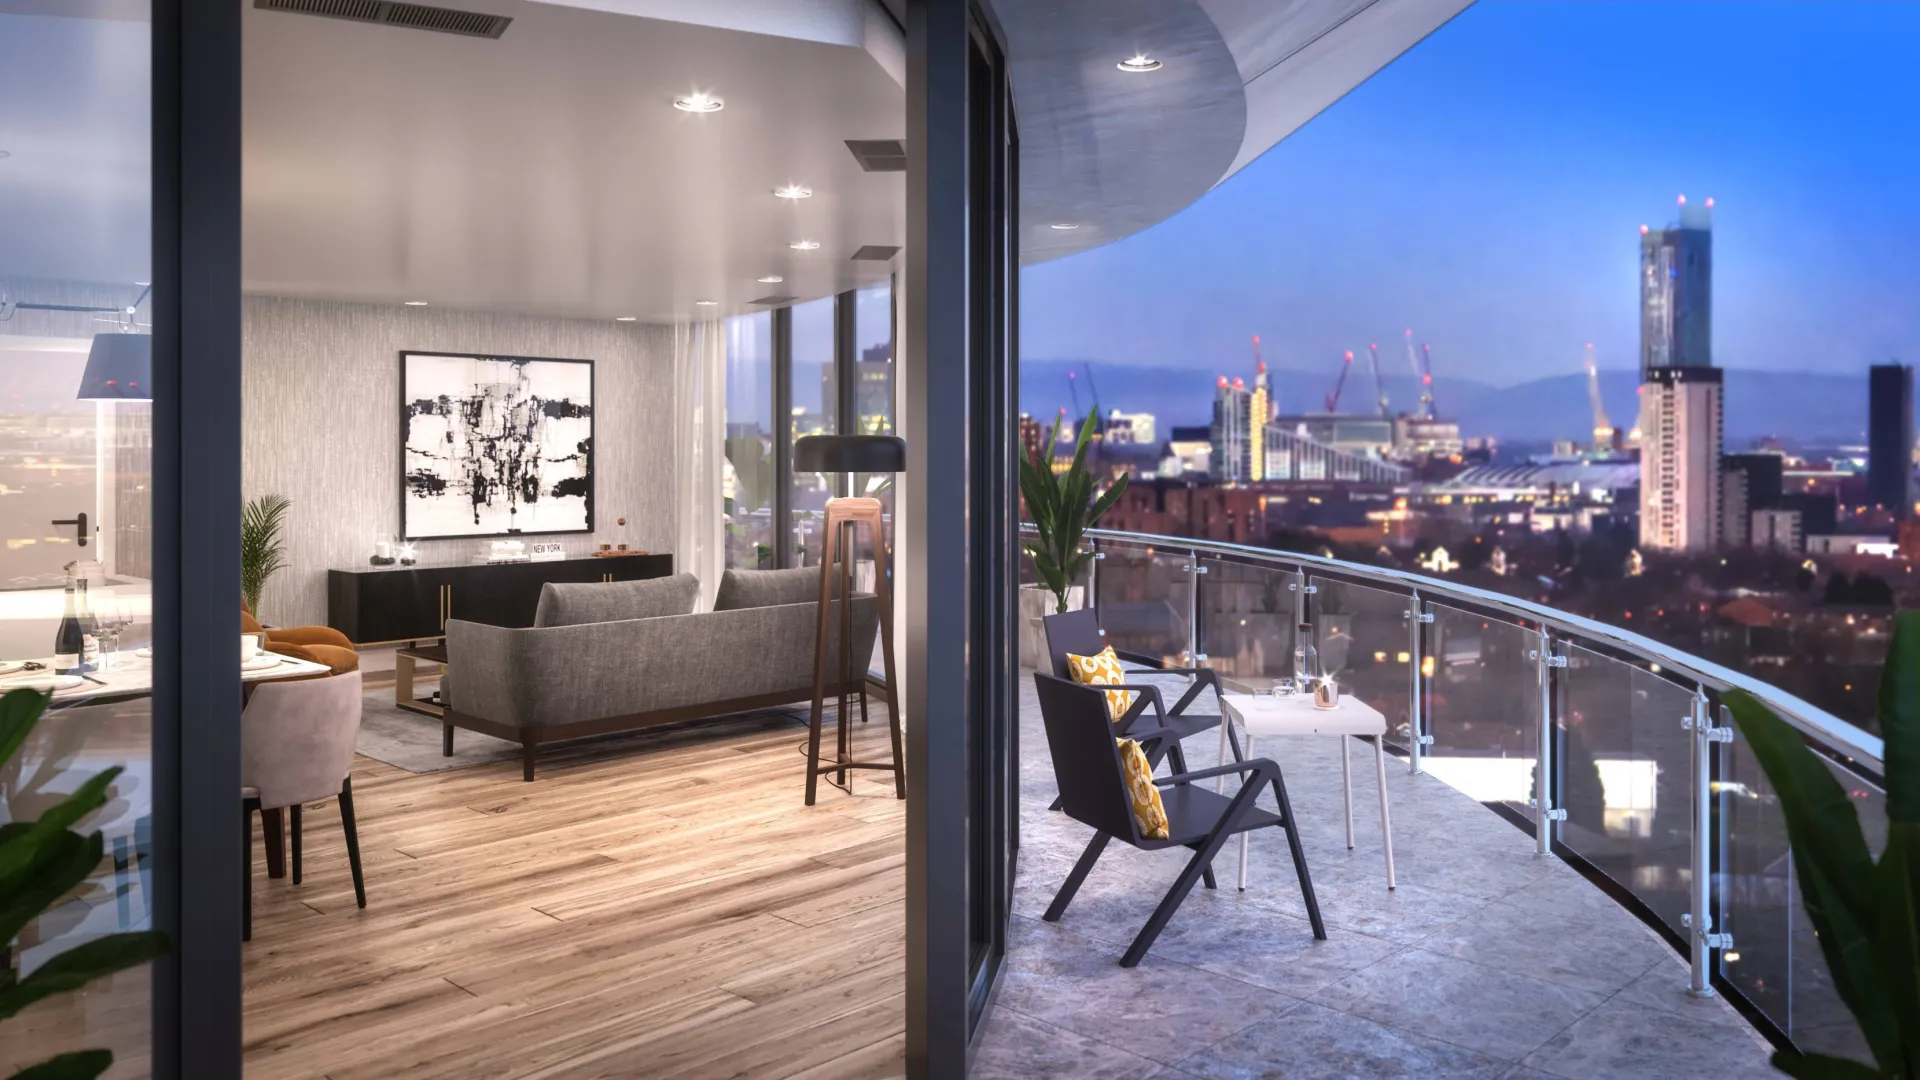
Completed properties are those that have been fully built, and are available to live in immediately. This type of investment is perfect for those looking to generate immediate returns, or those looking to use a mortgage to fund the purchase.
- It is possible to exchange and complete within 28 days.
- No risk of delays to build programme or generating returns.
- May come pre-tenanted, meaning you will avoid any void periods.
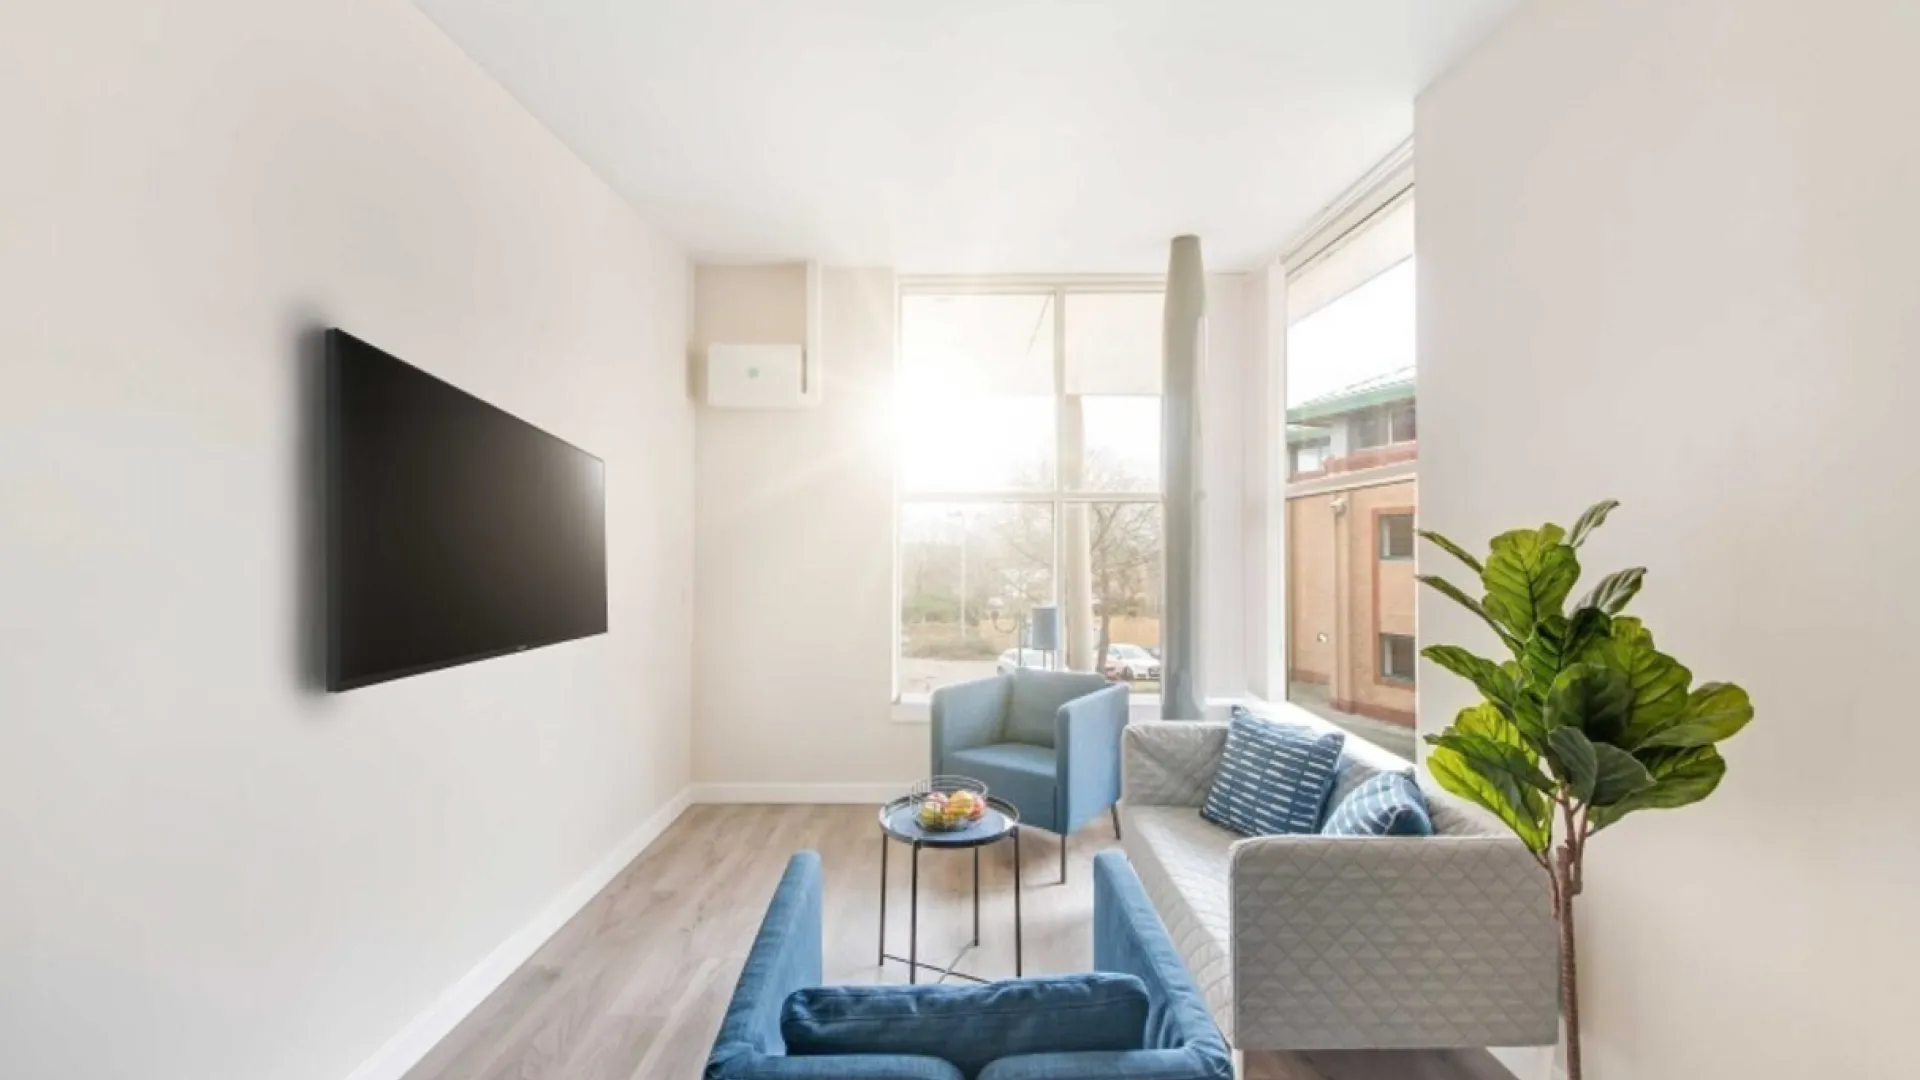
Buying a property off-plan means you are securing it prior to the development build being fully complete. This type of investment is perfect for those looking to secure a new property below market value, or those looking to spread their payments.
- Access to the newest properties on the market.
- Growth in the property's value over the build period.
- Reserve with a deposit and finance the balance on completion.